We organize your data until it answers your users’ questions. We know the directions you can take, and we guide you there
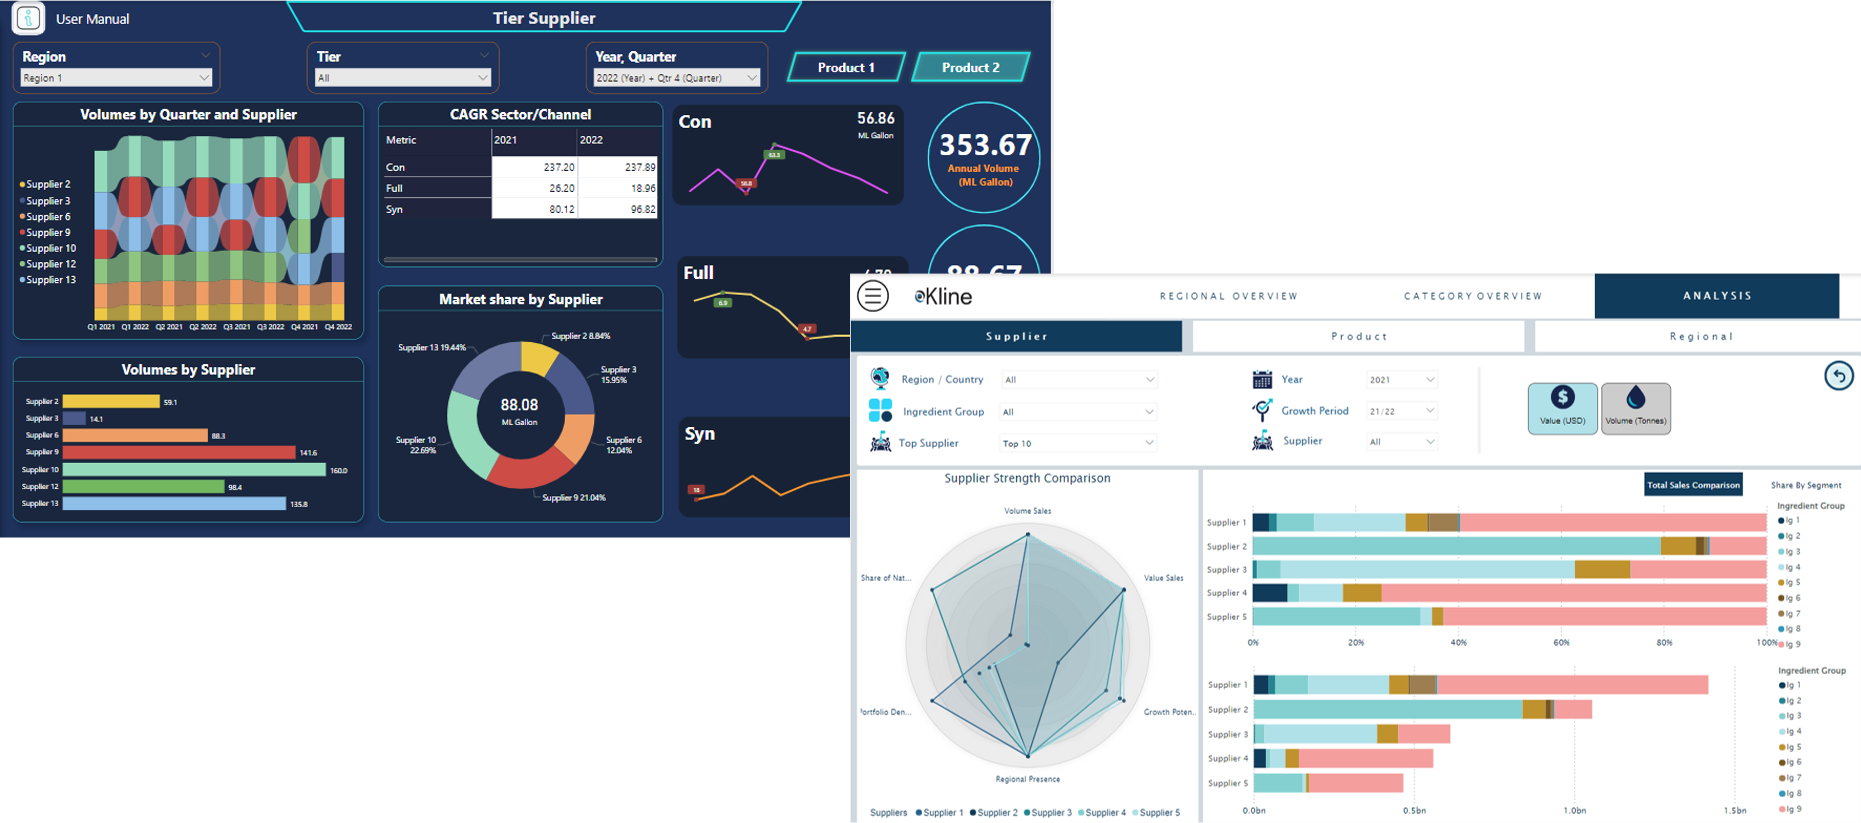
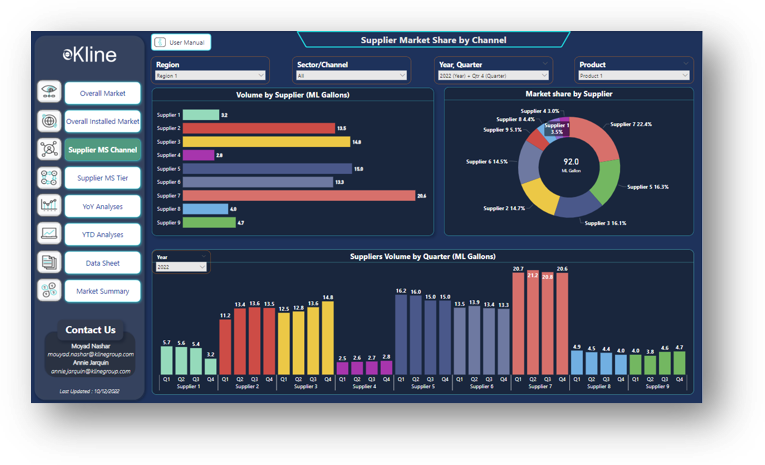
Customizable interactive dashboards
Dashboards are not restricted to Kline’s market research data. Businesses can plug and play these KPIs by ingesting their data
Transforming your data into insights
Clients who require access to all their countries and categories data sources with a simple user experience
Unlock data opportunities
Power BI and data visualization support through Kline BI experts to fast-track business intelligence requirements
What do we offer?
Dashboards, Scorecards, KPIs, Charts, Trend and Comparative Analyses, Heat Maps, and Graphs exemplify our BI development services for visual data depiction. With our expertise, you can derive valuable insights from your data, whether it’s stored on-premise or in the cloud.
DYNAMIC DASHBOARDS
Tailored to provide an at-a-glance view of your most critical metrics.
PRECISION SCORE CARDS
Offering structured performance evaluations for informed decision-making.
KEY PERFORMANCE INDICATORS (KPIS)
Laser-focused metrics to measure and drive success.
INTUITIVE HEAT MAPS & ENGAGING GRAPHS
Translating complex data into comprehensible and actionable visual stories. Visualize data density and patterns in vibrant color-coded formats.
COMPARATIVE ANALYSIS
Facilitating side-by-side evaluations for sharper, context-aware insights
TREND ANALYSIS
Capture the bigger picture by analyzing evolving patterns over time
Beyond Spreadsheets
Trade in cumbersome spreadsheets for advanced, real-time data visualizations. Dive into data with ease, spot business potentials, and sidestep spreadsheet hassles.
Decipher Complex Data
Illuminate hidden patterns, extract profound insights, and unlock the potential of data silos. Our tools, from charts to graphs, simplify understanding vast data sets.
Tailor-Made Reporting
Drive consistent productivity with customized reports. Empower decision-makers and experts to monitor KPIs effectively, keeping a finger on the pulse of business dynamics.
Streamlined Data Exploration
With dedicated dashboards, distill key data fragments from myriad sources. Our expertise reshapes how you perceive and channel data, offering clarity amidst complexity
Why Kline?
Experience in Market Data
With decades in market research, we don’t just understand data—we command it. Our mastery in market data positions us uniquely to craft the best BI solutions
Customizable Dashboards
Our tailor-made dashboards reflect your business’s unique needs, turning raw data into intuitive, actionable insights
Real-time Market Monitoring
Stay ahead of the curve with dashboards that provide real-time market insights, ensuring you’re always informed
Strategic Superiority
Elevate decision-making with razor-sharp insights, driving business growth
Turn Data into Assets
Instead of drowning in data, float atop with clear, actionable information
Data Alchemy
Sophisticated algorithms & tools harness data and mold it into cohesive patterns
We are market data wizards: Are you ready to unlock the next level of business intelligence? Reach out to us today and embark on a journey to explore our bespoke solutions.
We use cookies on our website to give you the most relevant experience by remembering your preferences and repeat visits. By clicking “Accept”, you consent to the use of ALL the cookies.
This website uses cookies to improve your experience while you navigate through the website. Out of these, the cookies that are categorized as necessary are stored on your browser as they are essential for the working of basic functionalities of the website. We also use third-party cookies that help us analyze and understand how you use this website. These cookies will be stored in your browser only with your consent. You also have the option to opt-out of these cookies. But opting out of some of these cookies may affect your browsing experience.
Necessary cookies are absolutely essential for the website to function properly. These cookies ensure basic functionalities and security features of the website, anonymously.
Cookie
Duration
Description
cookielawinfo-checkbox-analytics
11 months
This cookie is set by GDPR Cookie Consent plugin. The cookie is used to store the user consent for the cookies in the category "Analytics".
cookielawinfo-checkbox-functional
11 months
The cookie is set by GDPR cookie consent to record the user consent for the cookies in the category "Functional".
cookielawinfo-checkbox-necessary
11 months
This cookie is set by GDPR Cookie Consent plugin. The cookies is used to store the user consent for the cookies in the category "Necessary".
cookielawinfo-checkbox-others
11 months
This cookie is set by GDPR Cookie Consent plugin. The cookie is used to store the user consent for the cookies in the category "Other.
cookielawinfo-checkbox-performance
11 months
This cookie is set by GDPR Cookie Consent plugin. The cookie is used to store the user consent for the cookies in the category "Performance".
viewed_cookie_policy
11 months
The cookie is set by the GDPR Cookie Consent plugin and is used to store whether or not user has consented to the use of cookies. It does not store any personal data.
Functional cookies help to perform certain functionalities like sharing the content of the website on social media platforms, collect feedbacks, and other third-party features.
Performance cookies are used to understand and analyze the key performance indexes of the website which helps in delivering a better user experience for the visitors.
Analytical cookies are used to understand how visitors interact with the website. These cookies help provide information on metrics the number of visitors, bounce rate, traffic source, etc.
Advertisement cookies are used to provide visitors with relevant ads and marketing campaigns. These cookies track visitors across websites and collect information to provide customized ads.