Chemical Week recently published a ranking of the largest chemical companies in the world by revenues and Rob Westervelt, CW’s editor-in-chief, has commented on the rapid shifts taking placing in the sector. Only BASF, Dow Chemical, DuPont and Shell remain in the top ten from the first time CW published its ranking 15 years ago. Meanwhile, SABIC and Sinopec have grown rapidly and are now top ten players.
In addition to these changes in company rankings, there have been equally rapid changes in chemical companies’ business portfolios, largely due to M&A activity. Many medium-sized specialty chemical companies have been acquired by larger firms, resulting not just in a more concentrated industry but one in which more firms have blended commodity/specialty business portfolios. Dow’s acquisition of Rohm and Haas is the latest example of this trend.
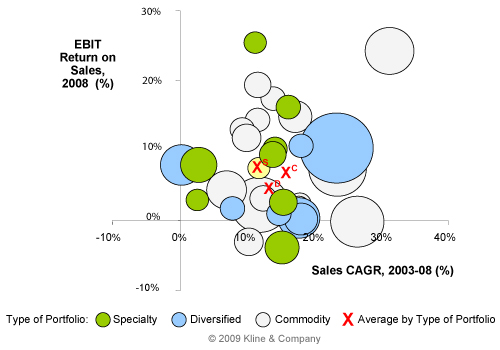
At the same time, commoditization has blurred the distinction between specialties and commodities. Back in the 1990s when CW first published its industry ranking, specialty chemical businesses typically out-performed commodity chemicals both in terms of sales growth and profitability. Now the picture is much less clear. Kline’s analysis of the global top 50 chemical companies (see figure below) shows major financial convergence across the industry. Whether leading chemical companies have business portfolios skewed to commodities or specialties, or have a balance of the two, average sales growth and margin performance is virtually the same.
Is this merely a result of growing industry maturity? Is it therefore unavoidable? Our view is ‘no’ to both questions. We believe that financial pressures have led companies to over-invest in differentiating commodity products while cutting costs in specialties, falling into what we call the ‘specialty trap’. More granular approaches to value creation are essential to improve the industry’s financial performance.
Top 50 Chemical Companies Worldwide:
Financial Performance by Type of Portfolio

Notes: Top 50 chemical companies worldwide by revenues. Circle size proportional to revenues. Data adjusted to exclude non-chemicals activities. Some companied were excluded where reliable data is unavailable.
Written by Jonathan Goldhill, Senior Vice President, Consulting Services at Kline
Thank you for sharing!


